
User`s guide

GUI to Interactively Explore Data in a Table (GUIDE)
function plot_t ype_ Callback(hObject, e vent data, handles)
% hObject handle to plot_type (see GCBO)
% eventdata re serv ed - to be defi ned in a future ver sion of MATLAB
% handles structure with handles and user data (see GUIDATA)
% ---- Customized as follow s ----
% Determine state of the po p-up and assign the appropriate string
% to the plot panel label
index = get(hObject,'Value'); % What plot type is requested?
strlist = get(hObject,'String') ; % Get the choice's name
set(handles.uipanel3,'Title',strlis t(index)) % Rename uip anel3
% Plot one axes at a time, changing data; first the populati on
table = get(handles.data_table, 'Data'); % Obtain the data table
refreshDisplays(table, handles, 1)
% Now compute stats for and plot the selec tion, if needed.
% Retrieve the stored event data for the l ast selection
selection = handles.currSelection;
if length(se lect ion) > 10 % If mo re than 10 rows selected
refreshDisplays(table(selection,:), handles, 2)
else
% Do nothing; insufficient observations for stati stics
end
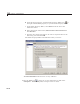
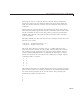
The function updates the Data Statistics table and the plots. To perform
the updates, it calls the
refreshDisplays function twice, which is a
custom function added to the G UI code file. In between the two calls, the
refreshDisplays function retrieves row indices for the current selection
from the
currSelection member of the handles structure, where they were
cached by the
data_table_CellSelectionCallback.
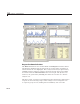
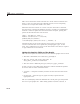
You can see the effect of toggling the plot type in the two illustrations that
follow. The one on the left shows the Sunspots v. Year plots, and the one on
the right shows the FFT Periodograms Plots. The selection in both cases is
the years 1901–1950.
10-43