
User`s guide

10 Examples of GUIDE GUIs
if ~isempty( peak )
stats{9,col} = peak; % Peak period from FFT
end
Note When assigning data to a uitable, use a cell array, as shown in the
code for
setStats. You can assign data that you retrieve from a uitable to
a numeric array, however, only if it is entirely numeric. Storing uitable
data in cell arrays enables tables to hold numbers, strings of characters, or
combinations of them.
The stats matrix is a 9-by-2 cell array in which each row is a separate statistic
computed from the
table argum ent. The last statistic is not com puted by
setStats; it comes from the plo tPer iod function when it computes and plots
the FFT periodogram and is passed to
setStats as the pea k parameter.
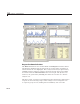
Specify the Type of Data Plot
At any time, the user of tablestat can choose either of two types of plots to
display with the
plot_type pop-up menu:
• Sunspots v. Year Plots — Time-series line graphs displaying sunspot
occurrences year by year (default).
• Periodogram Plots — Graphs displaying the FFT-derived power spectrum
of sunspot occurrences by length of cycle in years.
Note See also, “Fast Fourier Transform (FFT)” and “The FFT in O ne
Dimension”.
When the plot type changes, one or both axes refresh. They always show the
same kind of plot, but the bottom axes is initially empty and does not display
a g raph until the user selects at least 11 rows of the data table.
The callback of the
plot_type control is plot_type_Callb ack.GUIDE
generates it, and you must add code to it that updates plots appropriately.
In the example, the callback consists of this code:
10-42