
User`s guide

GUI to Interactively Explore Data in a Table (GUIDE)
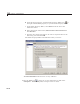
6 From the list of workspace variables in the box below the radio button,
select
sunspot and click OK.
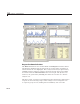
GUIDE inserts the sunspot data in the table.
Note If you are designing a GUI like this but need to allow your users to
load their own numeric data in place of the sunspot data, you nee d a w ay to
interrogate the MATLAB workspace and present a list of variables to the
user. The G UID E example “Access Workspace Variables from a List B ox
(GUIDE)” on page 10-61 describes how to provide this kind of functionality
with GUIDE. You can extend its functionality to list only variables of class
double, of a certain dimensionality, etc.
Compute the Data Statistics
The Opening Function retrieves the preloaded data from the data table and
calls the
setStats subfunction to compute population statistics, and then
returns them. The
data_table_CellSelectionCallback performs the same
action when the user selects more than 10 rows of the data table. The only
difference between these two calls is what input data is provided and what
column of the Data Statistics table is computed. Here is the
setStats
function:
function stats = setStats(table, stats, col, peak )
% Computes basic statistics for data table.
% table The data to summari ze (a population or selection)
% stats Array of statistics to update
% col Which column of the array to update
% peak Value for the peak period, com puted externally
stats{1,col} = size(table,1); % Number of rows
stats{2,col} = min(table(:,2));
stats{3,col} = max(table(:,2));
stats{4,col} = mean(table(:,2 ));
stats{5,col} = median(table(:,2));
stats{6,col} = std(table(:,2));
stats{7,col} = table(1,1); % First row
stats{8,col} = table(end,1); % Last r ow
10-41