
User`s guide

GUI to Interactively Explore Data in a Table (GUIDE)
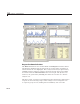
5 Drag out a second axes, leaving its name as axes2 inside the Sunsp ots v.
Year Plots pane l, directly below the first axes.
Leave enough space below each axes to display the x-axis labels.
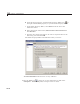
6 Identify the axes with labels. Using the Text tool, dra g out a sm all
rectangle in the upper right corner of the upper axes (
axes1). Double-click
it, and in the P roperty Inspector, change its
String property to Population
and its Tag property to poplabel.
7 Place a second label in the lower axes (axes2), renaming this text object
Selection and setting its Tag property to sellabel.
8 Create a title for the GUI. Using the Text tool, drag out a static text object
at the top left of the GUI, above the data table. Double-click it, and in
the Property Inspector, change its
String property to Zurich Sunspot
Statistics, 1700-1987
and its FontWeight property to bold.
9 Add a prompt above the axes; place a text label just above the Sunspots v.
Year Plots panel, near its right edge. Change its
Tag property to newf ig,
its
String property to Right-c lick plots for larg er view and its
FontAngle property to Itali c.
10 Makeapop-upmenutospecifythetypeofgraphtoplot. UsingthePop-up
Menu tool
, drag out a pop-up menu just above the Sunspots v. Year
panel, aligning it to the panel’s left edge. In t he Proper ty Inspector, set
these properties:
•
String to
Sunspots v. Year Plots
FFT Periodog ram Plots
• Tag to plot_type
• Tool tip to Choos e type of data plot
• Click the Callback property’s icon. This creates a declaration called
plot_type_Callback, to w hich you add code later on.
11 Select the P ush Button tool , and drag out a push button in the upper
right of the figure. In the Property Inspector, rename it to Quit and set
upitscallbackasfollows:
10-39