
User`s guide

GUI to Interactively Explore Data in a Table (GUIDE)
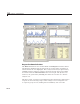
• A panel on the low er right, half the height of the first panel, renaming
its
Title to Data Statisti cs in the Property Inspector.
• A p anel above the Data Statistics panel, renaming its
Title to
Sunspots v. Ye ar Plots in the Property Inspector. This panel
changes its name when the type of plot that is displayed changes.
2 Using the Table tool , drag out a uitable inside the Data Set panel,
setting these properties in the Property Inspector to nondefault values:
•
ColumnName,settoYear and Sunspot.
•
Data, which you can set as described in the follow ing section “Initialize
the Data Table” on page 10-40.
•
Tag,settodata_table.
•
TooltipString,settoDrag to selec t a range of 11 or more
observations
.
•
CellSelectionCallback, which GUIDE automatically sets to
data_table_CellSelectionCallback and declares in the code file when
you click the pencil-and-paper
icon.
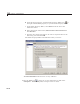
3 Drag out a second uitable, inside the Data Statistics panel, setting these
properties in the Property Inspector:
•
BackgroundColor to yellow (using the color picker).
•
ColumnName to Population and Sel ecti on.
•
Tag to data_stats.
•
TooltipString to stati stic s for table and selection.
•
RowName to nine strings: N, Min, Max, Mean , M edia n, Std Dev, 1st Year ,
Last Year,andEst. Period.
You can conveniently set these labels with the Table Property Editor as
follows:
a Double-click the Data Statistics tabletoopenitintheProperty
Inspector.
10-37