
User`s guide


GUI to Interactively Explore Data in a Table (GUIDE)
Function Name
Function Behavior
GUIDE-
Generated?
plotPeriod
Generates plots (either time series or
periodogram)
No
quit_Callback
Closes the figure
Yes
Design the tablestat GUI
• “Initialize the Data Table” on page 10-40
• “Compute the Data Statistics” on page 10-41
• “Specify the Type of Data Plot” on page 10-42
• “Respond to Data Selections” on page 10-44
• “Update the Statistics Table and the Graphs” on page 10-46
• “Display Graphs in New Figure Windows” on page 10-47
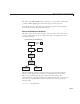
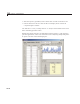
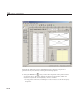
In the GUIDE Layout Editor, the
tablestat GUI looks like this.
10-35