
User`s guide

10 Examples of GUIDE GUIs
• Plots that portray periodicity in the entire data set and in selections of it.
• Context menus for the axes that let the user display their contents in
a separate figure window.
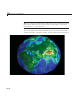
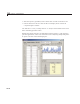
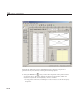
Use this GUI—or one you a d ap t from it— to analy ze and visualize time-series
data containing periodic events.
Besides the tables and axes, the GUI features three panels, a push button to
quit the application, static text, and functions for analyzing and plotting data.
It opens as shown in the following figure.
10-32