
User`s guide

GUI to Interactively Explore Data in a Table (GUIDE)
GUI to Interactively Explore Data in a Table (GUIDE)
In this section...
“About the tablestat Example” on page 10-31
“View and Run the tablestat GUI” on p age 10-33
“Design the tablestat GUI” on page 10-35
“Extend the tablestat GUI” on page 10-52
About the tablestat Example
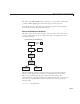
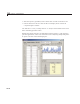
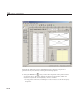
This example shows how to program callbacks for interactive data exploration,
including:
• An Opening Function to initialize a t a ble and a plo t.
• A uitable’s Cell Selection Callback to do plot selected data in real time as
the user selects data observations.
• A Pop-up menu’s callback to generate line graphs that display different
views of data.
• A context menu attached to an axes.
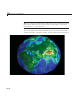
Use the GUI to plot different kinds of graphs into different axes for an entire
data set or selections of it, and to see how Fourier transforms can identify
periodicity in time series data. The GUI contains:
• A table of sunspot observations having two columns of data (dates and
observations).
• A second table, statistically summ arizing the data and a user-selected
subset of it.
• Two axes that plot time series o r Fourier analyses for the data and a
user-selected subset of it, each having a context menu that outputs its
contents to a new figure.
• A pop-up menu to change the type of data graph being displayed.
• A cell-selection callback that updates a column of statistics and a plot as
the user highlights observations.
10-31