
User`s guide
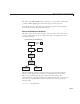
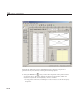

GUI for Animating a 3-D View (GUIDE)
Further Graphic
Explorations
You can enhance t
he pre sentation of
globegui in various ways, including:
• Adding a colorb
ar to show how colors correspond to terrain elevation above
and below sea le
vel
You cannot use
GUIDE to set up a colorbar, but you can do so in
axes1_Create
Fcn
. F or more information about using colorbars, see the
reference pag
efor
colorbar and “Adding a Colorbar to a Graph”.
• Displaying a
readout of longitude of the closest point on the globe to the
observer.
Use an
edit o
r
text style uicontrol that the function can update inside its
while loop w
ith the current azimuth (after expressing its value as degrees
East or West
of the Prime Meridian). Store this value in
handles.azimuth.
If you do th
is with an edit box that has an appropriate callback to update
the rotate
hgtransform, the user can update the globe’s longitude
interacti
vely.
Tip Manua
lly updating the longitude can take place while the globe
is spinn
ing. To do this, you can remove the temporary variable
az in
spinsto
pbutton_Callback
, r eplacing it with hand les.azimuth.
• Giving
the graticule smooth, curving edges rather than straight edges.
The
sph
ere
function returns a graticule grid that is, by design, very coarse
and do
es not have values in between grid lines that are needed to generate
smoot
h grid l ines. To overcome this, you can generate your own lines of
latit
ude and longitude separately as vectors of x, y,andz coordinates,
scali
ng their values to be slightly larger than a unit sphere.
• Mode
ling reflectance of light from the globe’s surface.
You c
an make the glo be loo k sh in y or dull with the
material function. Fo r
more
information, see “Reflectance Characteristics of Graphics Objects”.
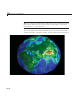
• Add
ing 3-D topographic relief to the globe
Thi
sinvolvesscalingthe
topo grid to a fraction of unity and assigning the
ZD
ata
intheglobesurfaceobjecttoit,aswellasusingtopo as its CData.
Us
ethe
surfl function to plot output from sphere.
10-29