
User`s guide

10 Examples of GUIDE GUIs
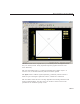
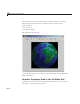
Texture and Color the Globe
Code in the ax es1_CreateFcn sets the CData for the globe to the 180-by-360
(one degree)
topo terrain grid by setting its FaceColor property to
'texturemap'. You can use any image or grid to texture a surface. Specify
surface p roperties as a struct containing one element per property that y ou
must set, as follows:
props.FaceColor= 'texture';
props.EdgeColor = 'none';
props.FaceLighting = 'gouraud';
props.Cdata = topo;
props.Parent = hgrotate;
hsurf = surface(x,y,z,props);
colormap(cmap)
Tip You can create MATLAB s tructs that contain values for sets of
parameters and provide them to functions instead of parameter-value pairs,
and save the structs to MAT-files for later use.
The surface function plots the surface into the axes. Setting the Parent
ofthesurfacetohgrotate puts the surface object under the control of the
hgtransform that spins the globe (see the illustration in “Orient the Globe
and Graticule” on page 10-27). By setting
EdgeColor to 'none',theglobe
displays face colors only, w ith no grid lines (which, by default, display in
black). The
colormap function sets the colormap for the surface to the 64-by-3
colormap
cmap defined in the code, which is appropriate for terrain display.
While you can use more colors, 64 is sufficient, given the relative coarseness
of the texture map (1-by-1 de gree resolution).
Plot the Graticule
Unlike the globe grid, the graticule grid displays with no face colors and gray
edge color. (You turn the g raticule grid on and off by clicking the Show grid
button.) Like the terrain map, it is a surfaceplot object; however, the
mesh
function creates it, rather than the surface function, as follows:
hmesh = mesh(gx,gy,gz,'parent',hgr otate,...
'FaceColor','none','EdgeColor',[.5 .5 .5]);
set(hmesh,'Visible','off')
10-26