
User`s guide

GUI for Animating a 3-D View (GUIDE)
• “Create the Graphic Objects” on page 10-25
• “Texture and Color the Globe” on page 10-26
• “Plot the Graticule” on page 10-26
• “Orient the Globe and Graticule” on page 10-27
• “Light the Globe and Shift the Light Source” on page 10-28
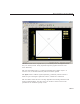
Create the Graphic Objects
The axes1_CreateF cn function initializes the axes, the two objects displayed
in it, a nd two
hgtransform objects that affect the rotation of the globe:
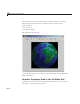
• The globe, a
surfaceplot object, generated by a call to surface.
• The geographic graticule (lines of latitude and longitude), also a
surfaceplot object, generated by a call to mesh.
Data for these two objects are rectangular x-y-z grids generated by the
sphere
function. The globe’s grid is 50-by-50 and the graticule grid is 8-by-15. (Every
other row of the 15-by-15 g rid returned by
sphere is removed t o equalize its
North-South and East-West spans when viewed on the globe.)
The axes x-, y-, and z-limits are set to
[-1.02 1.02].Becausethegraphic
objects are unit spheres, this leaves a little space around them while
constraining all three axes to r em ain the same relative and absolute size. The
graticule grid is also enlarged by 2%, which is barely enough to prevent the
opaque texture-mapped surface of the globe from obscuring the graticule. If
you w atch carefully, you can sometimes see missing pieces of graticule edges
as the globe spins.
Tip uipanels enclose the axes and the uicontrols. This makes the axes a
child of the uipanel that contains it. Containing axes in uipanels speeds up
graphic rendering by localizing the portion of the figure where M ATLAB
graphics functions redraw graphics.
10-25