
User`s guide
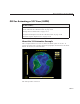

10 Examples of GUIDE GUIs
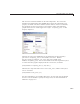
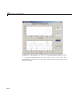
• Providing the appropriate data to the plot function
• Turning on the axes grid, w hich the
plot function automatically turns off
Performing the last step is necessary because many plotting functions
(including
plot) clear the axes and reset properties before creating the graph.
This meansthat you cannot use the Property Inspector to set the
XMinorTick,
YMinorTick, and grid properties in this example, because they are reset when
the callback executes
plot.
When looking at the follow ing code listing, note how the
handles structure
provides access to the handle of the axes, whe n needed.
Plot Button Code Listing
function plot_button_Call back(hObject, eventdata, handles, varargin)
% hObject handle to plot_button (see GCB O)
% eventdata reserved - to be defined in a future v ersion of MATLAB
% handles structure with handles and user data (see GUIDATA)
% Get user input from GUI
f1 = str2double(get(handles.f1_input,'String'));
f2 = str2double(get(handles.f2_input,'String'));
t = eval(get(handles.t_input,'String'));
% Calculate data
x = sin(2*pi*f1*t) + sin(2 *pi*f2*t);
y = fft(x,512);
m = y.*conj(y)/512;
f = 1000*(0:256)/512;
% Create frequency plot in proper axes
plot(handles.frequency_axes,f,m(1:257))
set(handles.frequency_axes,'XMinorTick','on')
grid on
% Create time plot in proper axes
plot(handles.time_axes,t,x)
set(handles.time_axes,'XMinorTick','on')
grid on
10-10