
User`s guide
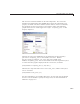
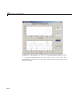

GUI with Multiple Axes (GUIDE)
• Evaluating the time string using eval to produce a vector t,whichthe
callback used to evaluate the mathematical expres sion.
The following code shows how the callback obtains the input:
% Get user input from GUI
f1 = str2double(get(handles.f1_ input,'String'));
f2 = str2double(get(handles.f2_ input,'String'));
t = eval(get(handles.t_input,'S tring'));
The Plot button callback avoid generating errors due to receiving improper
inputs. Tomakesurethattheinputs
f1, f2,andt can be used in
computations, the edit text callbacks test the values as soon as the user
enters them. To see how this is done, see “Validate User Input as Numbers”
on page 10-11 .
Calculate Data
After constructing the string input parameters to numeric form and assigning
them to local variables, the next step is to calculate data for the two graphs.
The
plot_button_Callback computes the time domain data using an
expression of sines:
x = sin(2*pi*f1*t) + sin(2*pi* f2*t);
The callback computes the frequency dom ain data as the Fourier transform of
thetimedomaindata:
y = fft(x,512);
For an explanation of this com putation, see the fft function.
Plot Data
The final task for the plot_button_Callback is to generate two plots. This
involves:
• Targeting p lots to the appropriate axes. For exam ple, this code directs a
graph to the time axes:
plot(handles.time_axes,t,x)
10-9