
User`s guide

GUI with Multiple Axes (GUIDE)
The structure contains handles for all G UI components. You access the
handles using field names that GUIDE derives from the components’
Tag
property. T o make code more readable (and to make it easier to remember)
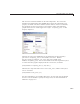
this example sets the
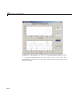
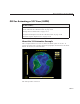
Tag property to descriptive names. The following
graphic shows how to set the upper axes
Tag to 'frequency_axes' in the
Property Inspector.
Altering the Tag causes GUIDE to set the field name for the frequency
plot axes to
frequency_axes in the handles structure. Within
the
plot_button_Callback, you access that axes’ handle with
handles.frequency_axes. You use the handle as the first argument to pl ot
to ensure that the graph is displayed in the correct axes, as follows:
plot(handles.frequency_axes,f,m(1:257))
Likewise, the Tag ofthetimeaxesissettotime_axes ,andthecalltoplot
uses it as foll ows:
plot(handles.time_axes,t,x)
For more information, see “handles Structure” on page 8-22. For the details
ofhowtousethehandletospecifythetargetaxes,see“PlotPushButton
Callback” on page 10-8.
10-7