
User`s guide

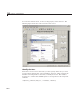

GUI with Multiple Axes (GUIDE)
• Frequency two (f2)
• Atimevector(
t)
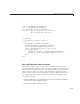
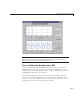
When the user clicks the Plot button, the GUI puts these values into a
MATLAB expression that is the sum of two sine functions:
x = sin(2*pi*f1*t) + sin(2*pi* f2*t)
The GUI then calculates the FFT (fast Fourier transform) of x and plots the
data in the frequency domain and the time domain in separate axes.
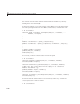
Specify Default Values for the Inputs
The GUI provides default values for the three inputs. This enables users to
click the Plot button and see a result as soon they run the G UI. The defaults
also indicate typical values that the user might e nter.
10-5