
User`s guide
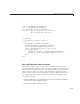

GUI with Multiple Axes (GUIDE)
Note You can create a more adv anced GUI that also displays time and
frequency plots by following the GUIDE example “GUI to Interactively
Explore Data in a Table (GUIDE)” on page 10-31.
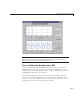
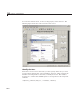
View and Run the Multiple Axes GUI
If you are reading this in the M ATLAB Help browser, you can access the
example FIG-file and code file by clicking the following links. If you are
reading this on the W eb or in PDF form, go to the corresponding section in the
MATLAB Help Browser to use the links.
If you intend to modify the layout or code of this GUI example, first s ave
copies of its code file and FIG-file to your current folder. (You need write
access to your current folder to do this.) C lick the following links to copy the
example files to your current folder and open them.
10-3