
User`s guide


10 Examples of GUIDE GUIs
GUI with Multiple Axes (GUIDE)
In this section...
“About the Multiple Axes Example” on page 10-2
“View and Run the M u ltip l e Axes GU I” on page 10-3
“Design the Multiple Axes GUI” on page 10-4
“Plot Push Button Callback” on page 10-8
“Validate User Input as Numbers” on page 10-11
About the Multiple Axes Example
This example creates a GUI that plots d ata that it derives from three
parameters entered by the user. The parameters define a time- and
frequency-varying signal. One of the GUI’s two axes displays the data in the
time domain and the other displays it in the frequency domain. GUI-building
techniques illustrated in this example include:
• Controlling which axes object is the target for p lotting commands.
• Using edit text controls to read numeric input and MATLAB expressions.
• Converting user inputs from strings to n um bers and validating the result.
• Restoring focus to an edit text box when user input fails validation.
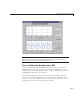
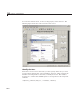
When you first open the Signal Analysis G UI, it looks as shown in the
following figure. It evaluates the expression printed at the top of the figure
using the parameters
f1, f2,andt that the user enters. The upper line
graph displa ys a Fourier tran sform of the computed sign al displayed in th e
lower line graph.
10-2