
User`s guide

8 Programming a GUIDE GUI
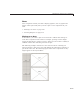
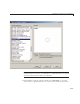
1 Add this code to the Plot 1 push button’s Callback callback. The surf
function produces a 3-D shaded surface plot. The peaks function returns a
square matrix obtained by translating and scaling Gaussian distributions.
surf(handles.axes1,peaks(35));
2 Add this code to the Plot 2 push button’s Callback callback. The contour
function displays the contour plot of a matrix, in this case the output
of
peaks.
contour(handles.axes2,peaks(35));
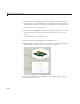
3 Run the GUI by selecting Run fro m the Tools menu.
4 Click the Plot 1 button to display the surf plot in the first axes. Click the
Plot 2 button to display the contour plot in the second axes.
See “GUI with Multiple Axes (GUIDE)” on page 10-2 for a more complex
example that uses two axes.
8-46