
User`s guide

6 Lay Out a GUIDE GUI
Note For more information and additional tips and techniques, see
“Add a Component to a Panel or Button Group” on page 6-34 and the
uibuttongroup documentation.
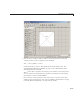
Define Axes
Axes enable your GUI to display graphics such as graphs and images using
commands such as:
plot, su rf, line, bar, polar, pie, contour,andmesh.
To define an axes, you must set certain properties. To do this:
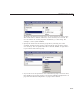
1 Use the Property Inspector to modify the appropriate properties. Open the
Property Inspector by selecting Prop erty Insp ector from the View menu
or by clicking the Property Inspector button
.
2 In the layout area, select the component you are defining.
Note See“Available Components” on page 6-20 for a description of this
component.
Subsequent topics describe commonly used properties of axes and offer a
simple example.
• “Commonly Used Properties” on page 6-62
• “Axes ” on page 6-63
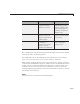
Commonly Used Properties
The most commonly used properties n eeded to describe an axes are shown
in the f ollowing ta ble:
6-62