
Specifications

2 Creating a GUI
2-24
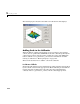
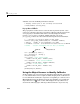
Add this code to the Contour push button callback:
% Display contour plot of the currently selected data
contour(handles.current_data);
Pop-up Menu Callback
The pop-up menu enables users to select the data to plot. Every time a user
selects one of the three plots, the pop-up menu callback reads the pop-up menu
Value property to determine what item is currently displayed and sets
handles.current_data accordingly. Add the following code to the
plot_popup_Callback after the comments following the function definition.
% --- Executes on selection change in data_popup.
function plot_popup_Callback(hObject, eventdata, handles)
% hObject handle to surf_pushbutton (see GCBO)
% eventdata reserved - to be defined in a future version of MATLAB
% handles structure with handles and user data (see GUIDATA)
val = get(hObject,'Value');
str = get(hObject, 'String');
switch str{val};
case 'peaks' % User selects peaks
handles.current_data = handles.peaks;
case 'membrane' % User selects membrane
handles.current_data = handles.membrane;
case 'sinc' % User selects sinc
handles.current_data = handles.sinc;
end
guidata(hObject,handles)
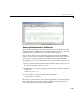
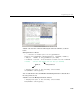
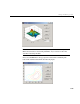
Using the Object Browser to Identify Callbacks
In this example, it is easy to keep track of the GUI component that corresponds
to each callback. But in a more complicated GUI, keeping track of callbacks can
be more difficult. To identify the component corresponding to a callback, select
Object Browser from the View menu in the Layout Editor or by clicking the
Object Browser icon on the toolbar. This displays the Object Browser as
shown in the following figure. The Object Browser lists the
tag and string
Add this code
Autogenerated code