
Specifications

Programming the GUI
2-21
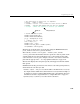
% This function has no output args, see OutputFcn.
% hObject handle to figure
% eventdata reserved - to be defined in a future version of MATLAB
% handles structure with handles and user data (see GUIDATA)
% varargin command line arguments to untitled (see VARARGIN)
% Create the data to plot
handles.peaks=peaks(35);
handles.membrane=membrane;
[x,y] = meshgrid(-8:.5:8);
r = sqrt(x.^2+y.^2) + eps;
sinc = sin(r)./r;
handles.sinc = sinc;
handles.current_data = handles.peaks;
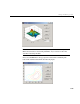
surf(handles.current_data)
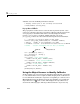
The first six executable lines create the data using the MATLAB functions
peaks, membrane and sinc to generate the data.
The next line,
handles.current_data = handles.peaks, sets the
current_data field of the handles structure equal to the data for peaks. In the
example GUI, the pop-up menu displays
peaks as the initial selection. The
value of
handles.current_data changes each time a user selects a different
plot from the pop-up menu — see “Pop-up Menu Callback” on page 2-24.
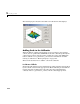
The last line displays the surf plot for peaks, which appears when the GUI is
first opened.
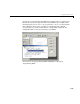
GUIDE automatically generates two more lines of code in the opening function,
which follow the code that you add:
•
handles.output = hObject saves the handle to the GUI for later access by
the output function. While this command is not necessary in this example, it
is useful if you want to return the GUI handle to the command line. For more
information about the output function see “Output Function” on page 4-5.
•
guidata(hObject,handles) saves the handles structure.
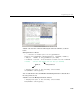
Add this code
Autogenerated code