
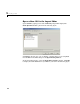
Specifications


2 Creating a GUI
2-2
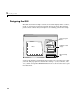
Designing the GUI
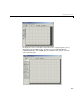
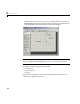
The GUI used in this example contains an axes that displays either a surface,
mesh, or contour plot of data selected from the pop-up menu. The following
picture shows a sketch that you might use as a starting point for the design.
A panel contains three push buttons that enable you to select the type of plot
you want. The pop-up menu contains three strings —
peaks, membrane, and
sinc, which correspond to MATLAB functions. You can select the data to plot
from this menu.
Select Data
peaks
Contour
Mesh
Surf
Axes
Push buttons to select
plot type
Menu for selecting
data
Plot Types
Panel to group push
buttons