
Specifications

A GUI to Set Simulink Model Parameters
5-27
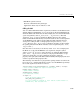
set(handles.ResultsList,'Value',currentVal,'String',resultsStr)
% Store the new ResultsData
guidata(hObject, handles)
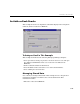
Plotting the Results Data
The GUI Plot button callback creates a plot of the run data and adds a legend.
The data to plot is passed to the callback in the
handles structure, which also
contains the gain settings used when the simulation ran. When a user clicks on
the
Plot button, the callback executes the following steps:
• Collects the data for each run selected in the
Results list, including two
variables (time vector and output vector) and a color for each result run to
plot.
• Generates a string for the legend from the stored data.
• Creates the figure and axes for plotting and saves the handles for use by the
Close button callback.
• Plots the data, adds a legend, and makes the figure visible.
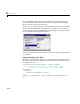
Plotting Into the Hidden Figure
The figure that contains the plot is created invisible and then made visible
after adding the plot and legend. To prevent this figure from becoming the
target for plotting commands issued at the command line or by other GUIs, its
HandleVisibility and IntegerHandle properties are set to off. However, this
means the figure is also hidden from the
plot and legend commands.
Use the following steps to plot into a hidden figure:
• Save the handle of the figure when you create it.
• Create an axes, set its
Parent property to the figure handle, and save the
axes handle.
• Create the plot (which is one or more line objects), save these line handles,
and set their
Parent properties to the handle of the axes.
• Make the figure visible.
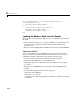
Plot Button Callback Listing
Here is the Plot button callback.
function PlotButton_Callback(hObject, eventdata, handles)