
Specifications
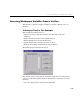
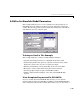

Accessing Workspace Variables from a List Box
5-17
Reading the Selections from the List Box
This GUI requires the user to select two variables from the workspace and then
choose one of three plot commands to create the graph:
plot, semilogx, or
semilogy.
Enabling Multiple Selection
To enable multiple selection in a list box, you must set the Min and Max
properties so that
Max Min > 1. This requires you to change the default Min
and
Max values of 0 and 1 to meet these conditions. Use the Property Inspector
to set these properties on the list box.
How Users Select Multiple Items
List box multiple selection follows the standard for most systems:
•
Control-click left mouse button — noncontiguous multi-item selection
•
Shift-click left mouse button — contiguous multi-item selection
Users must use one of these techniques to select the two variables required to
create the plot.
Returning Variable Names for the Plotting Functions
The get_var_names subroutine returns the two variable names that are
selected when the user clicks on one of the three plotting buttons. The function
• Gets the list of all items in the list box from the
String property.
• Gets the indices of the selected items from the
Value property.
• Returns two string variables, if there are two items selected. Otherwise
get_var_names displays an error dialog explaining that the user must select
two variables.
Here is the code for
get_var_names:
function [var1,var2] = get_var_names(handles)
list_entries = get(handles.listbox1,'String');
index_selected = get(handles.listbox1,'Value');
if length(index_selected) ~= 2
errordlg('You must select two variables',...
'Incorrect Selection','modal')
else