
Specifications
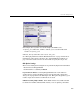


GUI with Multiple Axes
5-7
• Making the appropriate axes current using the axes command and the
handle of the axes. For example,
axes(handles.frequency_axes)
• Issuing the plot command.
• Setting any properties that are automatically reset by the
plot command.
The last step is necessary because many plotting commands (including
plot)
clear the axes before creating the graph. This means you cannot use the
Property Inspector to set the
XMinorTick and grid properties that are used in
this example, since they are reset when the callback executes
plot.
When looking at the following code listing, note how the
handles structure is
used to access the handle of the axes when needed.
Plot Button Code Listing
function plot_button_Callback(hObject, eventdata, handles)
% hObject handle to plot_button (see GCBO)
% eventdata reserved - to be defined in a future version of MATLAB
% handles structure with handles and user data (see GUIDATA)
% Get user input from GUI
f1 = str2double(get(handles.f1_input,'String'));
f2 = str2double(get(handles.f2_input,'String'));
t = eval(get(handles.t_input,'String'));
% Calculate data
x = sin(2*pi*f1*t) + sin(2*pi*f2*t);
y = fft(x,512);
m = y.*conj(y)/512;
f = 1000*(0:256)/512;;
% Create frequency plot
axes(handles.frequency_axes) % Select the proper axes
plot(f,m(1:257))
set(handles.frequency_axes,'XMinorTick','on')
grid on
% Create time plot
axes(handles.time_axes) % Select the proper axes