
Specifications

4 Programming GUIs
4-14
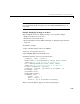
radio button. It then uses the Tag property of the selected object to choose the
appropriate code to execute.
function uibuttongroup1_SelectionChangeFcn(hObject,eventdata,handles)
% hObject handle to uipanel1 (see GCBO)
% eventdata reserved - to be defined in a future version of MATLAB
% handles structure with handles and user data (see GUIDATA)
selection = get(hObject,'SelectedObject');
switch get(selection,'Tag')
case 'radiobutton1'
% code piece when radiobutton1 is selected goes here
case 'radiobutton2'
% code piece when radiobutton2 is selected goes here
% ...
end
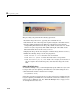
Axes
Axes enable your GUI to display graphics (e.g., graphs and images). Like all
graphics objects, axes have properties that you can set to control many aspects
of its behavior and appearance. See “Axes Properties” in the MATLAB
Graphics documentation for general information on axes objects.
Axes Callbacks
Axes are not uicontrol objects, but can be programmed to execute a callback
when users click a mouse button in the axes. Use the axes
ButtonDownFcn
property to define the callback.
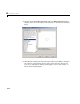
Plotting to Axes in GUIs
If your GUI contains axes, you should make sure that the Command-line
accessibility
option in the GUI Options dialog is set to Callback (the default).
This enables you to issue plotting commands from callbacks without explicitly
specifying the target axes. See “Command-Line Accessibility” on page 3-27 for
more information about how this option works.