
Specifications

A GUI to Set Simulink Model Parameters
5-35
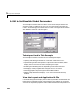
structure. When a user clicks on the Remove button, the callback executes the
following steps:
•Determines which list box items are selected when a user clicks on the
Remove button and removes these items from the list box String property
by setting each item to the empty matrix
[].
•Removes the deleted data from the
handles structure.
•Displays the string
<empty> and disables the Remove and Plot buttons
(using the
Enable property), if all the items in the list box are removed.
•Save the changes to the
handles structure (guidata).
Here is the
Remove button callback.
function varargout = RemoveButton_Callback(h, eventdata, handles, varargin)
currentVal = get(handles.ResultsList,'Value');
resultsStr = get(handles.ResultsList,'String');
numResults = size(resultsStr,1);
% Remove the data and list entry for the selected value
resultsStr(currentVal) =[];
handles.ResultsData(currentVal)=[];
% If there are no other entries, disable the Remove and Plot button
% and change the list sting to <empty>
if isequal(numResults,length(currentVal)),
resultsStr = {'<empty>'};
currentVal = 1;
set([handles.RemoveButton,handles.PlotButton],'Enable','off')
end
% Ensure that list box Value is valid, then reset Value and String
currentVal = min(currentVal,size(resultsStr,1));
set(handles.ResultsList,'Value',currentVal,'String',resultsStr)
% Store the new ResultsData
guidata(h,handles)
Plotting the Results Data
The GUI Plot button callback creates a plot of the run data and adds a legend.
The data to plot is passed to the callback in the
handles structure, which also
contains the gain settings used when the simulation ran. When a user clicks on
the
Plot button, the callback executes the following steps: