
Specifications

5 Application Examples
5-30
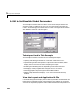
Plotting the Results
You can generate a plot of one or more simulation results by selecting the row
of results (
Run1, Run2, etc.) in the Results list that you want to plot and clicking
the
Plot button. If you select multiple rows, the graph contains a plot of each
result.
The graph is displayed in a figure, which is cleared each time you click the
Plot
button. The figure’s handle is hidden so that only the GUI can display graphs
in this window.
Removing Results
To remove a result from the Results list, select the row or rows you want to
remove and click the
Remove button.
Launching the GUI
The GUI is nonblocking and nonmodal since it is designed to be used as an
analysis tool.
Application Options Settings
This GUI uses the following application option settings:
•Resize behavior:
Non-resizable
•Command-line accessibility: Off
•Application M-file options selected:
Generate callback function prototypes
Application allows only one instance to run
Use system color scheme for background
Opening the Simulink Block Diagrams
This example is designed to work with the F14 Simulink model. Since the GUI
sets parameters and runs the simulation, the F14 model must be open when
the GUI is displayed. When the application M-file launches the GUI, it
executes the
model_open subfunction. The purpose of the subfunction is to:
•Determine if the model is open (
find_system).
•Open the block diagram for the model and the subsystem where the
parameters are being set, if not open already (
open_system).