
Specifications

1 Getting Started with GUIDE
1-6
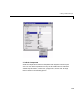
The popup menu contains three strings – “peaks”, “membrane”, and “sinc”,
which enable the user to select the data to plot. The GUI program generates
this data by executing one of three functions.
Example – Laying Out the GUI
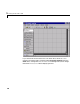
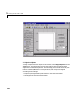
This section illustrates how to layout GUI components (i.e., user interface
controls, like push buttons, popup menus, text labels, etc.) in the GUI.
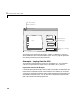
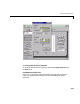
Layout and Code for the Example
Use the following links to display the GUIDE Layout Editor and the MATLAB
Editor with a completed version of this example. This enables you to see the
values of all component properties and to understand how the components are
assembled to create the GUI. You can also see a complete listing of the code
that is discussed in the following sections.
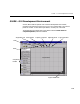
)LOH
Select Data
peaks
Contour
Mesh
Surf
Axes
Push buttons to
select plot type
Popup for selecting
data
File menu with
Print and Close