
Specifications

GUI with Multiple Axes
5-7
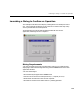
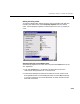
Callback Accessibility of Object Handles. When GUIs include axes, handles should
be visible from within callbacks. This enables you to use plotting commands
like you would on the command line. Note that
Callback is the default setting
for command-line accessibility.
Plot Push Button Callback
This GUI uses only the Plot button callback; the edit text callbacks are not
needed and have been deleted from the application M-file. When a user clicks
the
Plot button, the callback performs three basic tasks – it gets user input
from the edit text components, calculates data, and creates the two plots.
Getting User Input
The three edit text boxes provide a way for the user to enter the values for the
two frequencies and the time vector. The first task for the callback is to read
these values. This involves:
•Reading the current values in the three edit text boxes using the
handles
structure to access the edit text handles.
•Converting the two frequency values (
f1 and f2) from string to doubles using
str2double.
•Evaluating the time string using
eval to produce a vector t, which the
callback used to evaluate the mathematical expression.
The following code shows how the callback obtains the input.
% Get user input from GUI
f1 = str2double(get(handles.f1_input,'String'));
f2 = str2double(get(handles.f2_input,'String'));
t = eval(get(handles.t_input,'String'));
Calculating Data
Once the input data has been converted to numeric form and assigned to local
variables, the next step is to calculate the data needed for the plots. See the
fft
function of an explanation of how this is done.
Targeting Specific Axes
The final task for the callback is to actually generate the plots. This involves: