
Specifications

5 Application Examples
5-4
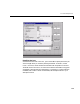
View the Layout and Application M-File
Use the following links to display the GUIDE Layout Editor and the MATLAB
Editor with a completed version of this example. This enables you to see the
values of all component properties and to understand how the components are
assembled to create the GUI. You can also see a complete listing of the code
that is discussed in the following sections.
Note The following links execute MATLAB commands and are designed to
work within the MATLAB Help browser. The first link adds a directory to your
MATLAB path.
Click here to display this GUI in the Layout Editor.
Click here to display the application M-file in the MATLAB Editor.
Design of the GUI
This GUI requires three input values:
•Frequency one (
f1)
•Frequency two (
f1)
•A time vector (
t)
When the user clicks the
Plot button, the GUI puts these values into a
MATLAB expression that is the sum of two sine function:
x = sin(2*pi*f1*t) + sin(2*pi*f2*t)
The GUI then calculates the FFT of x and creates two plots – one frequency
domain and one time domain.
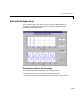
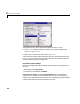
Specifying Default Values for the Inputs
The GUI uses default values for the three inputs. This enables users to click on
the
Plot button and see a result as soon as the GUI is launched. It also helps
to indicate what values the user might enter.
To create the default values, set the
String property of the edit text. The
following pictures shows the value set for the time vector.