
User`s guide

Vector Scope
5-521
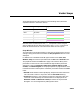
These settings plot the signal channels in the following colors (8-bit RGB
equivalents shown in the center column).
Note that the first (leftmost) list item,
'k', corresponds to the first signal
channel (leftmost column of the input matrix). See
ColorSpec in the online
MATLAB documentaion for more information about the color syntax.
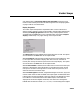
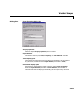
Scope Window
The scope title (in the window title bar) is the same as the block title. The axis
scaling is set by parameters listed under the
Axis properties check box in the
dialog box.
In addition to the standard MATLAB figure window menus (
File, Edit,
Window, Help), the Vector Scope window has an Axes and a Channels menu.
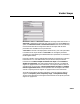
The properties listed in the
Axes menu apply to all channels. Many of the
parameters in this menu are also accessible through the block parameter
dialog box. These are
Persistence, Show grid, Compact display, Frame
number
, and Channel legend; see “Display Properties” on page 5-515 for more
information. Below are descriptions of the other parameters listed in the
Axes
menu:
•
Refresh erases all data on the scope display, except for the most recent trace.
This command is useful in conjunction with the
Persistence setting.
•
Autoscale resizes the y-axis to best fit the vertical range of the data. The
numerical limits selected by the autoscale feature are displayed in the
Minimum Y-limit and Maximum Y-limit parameters in the parameter
dialog box. You can change them by editing those values.
Color RGB Equivalent Appearance
Black (0,0,0)
Blue (0,0,255)
Red (255,0,0)
Green (0,255,0)
Dark purple (192,0,192)