
User`s guide

Vector Scope
5-520
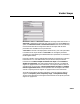
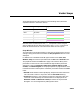
These settings plot the signal channels with the following styles.
Note that the first (leftmost) list item,
'*', corresponds to the first signal
channel (leftmost column of the input matrix). See the
Marker property of the
line function in the MATLAB documentaion for more information about the
available markers.
Type the word
stem instead of one of the basic Marker shapes to produce a stem
plot for the data in a particular channel.
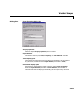
The
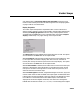
Line colors parameter specifies the color in which each channel’s data is
displayed on the scope. The syntax specifies the channel colors in list form,
with each list entry specifying a color (in one of MATLAB’s
ColorSpec formats)
for the corresponding channel’s data. The list entries are separated by the pipe
symbol, |.
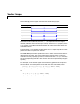
For example, a five-channel signal would ordinarily generate all five plots in
the color black. To instead plot the lines with the color order below, enter
or
Marker Style Appearance
Asterisk
Point
Cross
Square
Diamond
➄➃➂➁➀
[0 0 0] | [0 0 1] | [1 0 0 ] | [0 1 0] | [.7529 0 .7529]
➄➃➂➁➀
'k' | 'b' | 'r' | 'g' | [.7529 0 .7529]