
User`s guide

Vector Scope
5-517
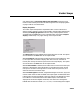
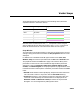
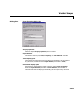
Minimum Y-limit and Maximum Y-limit set the range of the vertical axis. If
Autoscale is selected from the right-click pop-up menu or from the Axes menu
option, the
Minimum Y-limit and Maximum Y-limit values are automatically
recalculated to best fit the range of the data on the scope. Both of these
parameters are available for all input domains.
Y-axis title is the text to be displayed to the left of the y-axis. This parameter
is available for all input domains.
X-axis title is an analogous parameter
available only when plotting user-defined data (this parameter is not visible in
the dialog box shown).
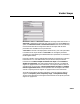
Frequency-domain and user-defined data need extra information to scale the
horizontal axis. For user-defined data, the parameters that provide this
information are
Inherit sample increment from input and Increment in
sample in input frame
. See “Scaling the Horizontal Axis for User-Defined
Signals” on page 5-513 for more information. For frequency-domain data, an
analogous pair of parameters,
Inherit sample time from input and Sample
time of original time series
, must be specified. See “Scaling the Horizontal
Axis for Frequency-Domain Signals” on page 5-513 for more information.
Three other parameters related to scaling the x-axis for frequency-domain
signals are
Frequency units, Frequency range, and Amplitude scaling.
These are also described in “Scaling the Horizontal Axis for Frequency-Domain
Signals” on page 5-513.