
User`s guide


Matrix Viewer
5-292
5Matrix Viewer
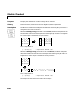
Purpose Display a matrix as a color image.
Library DSP Sinks
Description The Matrix Viewer block displays an M-by-N matrix input by mapping the
matrix element values to a specified range of colors. The display is updated as
each new input is received. (A length-M 1-D vector input is treated as an
M-by-1 matrix.)
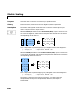
Image Properties
Click on the Image properties check box to expose the image property
parameters, which control the colormap and display.
The mapping of matrix element values to colors is specified by the
Colormap
matrix
, Minimum input, and Maximum input parameters. For a colormap
with L colors, the colormap matrix has dimension L-by-3, with one row for each
color and one column for each element of the RGB triple that defines the color.
Examples of RGB triples are
[100](red)
[001](blue)
[0.8 0.8 0.8] (light gray)
See
ColorSpec in the MATLAB documentation for complete information about
defining RGB triples.
MATLAB provides a number of functions for generating predefined colormaps,
such as
hot, cool, bone, and autumn. Each of these functions accepts the
colormap size as an argument, and can be used in the
Colormap matrix
parameter. For example, if you specify
gray(128) for the Colormap matrix
parameter, the matrix is displayed in 128 shades of gray. The color in the first
row of the colormap matrix is used to represent the value specified by the
Minimum input parameter, and the color in the last row is used to represent
the value specified by the
Maximum input parameter. Values between the
minimum and maximum are quantized and mapped to the intermediate rows
of the colormap matrix.
The documentation for MATLAB’s
colormap function provides complete
information about specifying colormap matrices, and includes a complete list of
the available colormap functions.