
User`s guide

Histogram
5-224
5Histogram
Purpose Generate the histogram of an input or sequence of inputs.
Library Statistics
Description The Histogram block computes the frequency distribution of the elements in
each column of the input, or tracks the frequency distribution in a sequence of
inputs over a period of time. The
Running histogram parameter selects
between basic operation and running operation, described below.
The block sorts the elements of each column into the number of discrete bins
specified by the
Number of bins parameter, n.
y = hist(u,n) % Equivalent MATLAB code
Complex inputs are sorted by their magnitudes.
The histogram value for a given bin represents the frequency of occurrence of
the input values bracketed by that bin. The upper-boundary of the
highest-valued bin is specified by the
Maximum value of input parameter,
B
M
, and the lower-boundary of the lowest-valued bin is specified by the
Minimum value of input parameter, B
m
. The bins have equal width of
and centers located at
Input values that fall on the border between two bins are sorted into the
lower-valued bin; that is, each bin includes its upper boundary. For example, a
bin of width 4 centered on the value 5 contains the input value 7, but not the
input value 3. Input values greater than the
Maximum value of input
parameter or less than
Minimum value of input parameter are sorted into the
highest-valued or lowest-valued bin, respectively.
Basic Operation
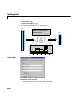
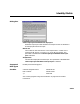
When the Running histogram check box is not selected, the block computes
the frequency distribution of each column in the M-by-N input
u independently
at each sample time.
∆
B
M
B
m
–
n
-----------------------=
B
m
k
1
2
---+
∆ k+ 012… n 1–,,, ,=