
User`s guide

Chirp
5-73
Open the Example 4 model by clicking here in the MATLAB Help Browser.
Run your model to see the time domain output, and then type the following
command to view the chirp output spectrogram.
specgram(dsp_examples_yout,[0:.1:30],400,hamming(128),110);
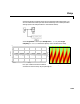
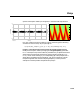
Example 5: Output Sweep with Frequencies Greater Than Half the Sampling Frequency.
Modify the Example 1 model by changing the Target frequency parameter
to
275. The output chirp of this model may not behave as you expect because the
sweep contains frequencies greater than half the sampling frequency (
200
Hertz
), which causes aliasing. If you unexpectedly get a chirp output with a
spectrogram resembling the one following, your chirp’s sweep may contain
frequencies greater than half the sampling frequency. See the previous
example for another possible unexpected chirp output.
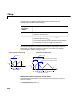
TIME (s)
FREQUENCY
0 1 2 3 4 5
0
5
10
15
20
25
30
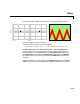
0 1 2 3 4 5 6
−10
−5
0
5
10
Frame: 6
TIME (s)
AMPLITUDE