
User`s guide

Chirp
5-72
Open the Example 3 model by clicking here in the MATLAB Help Browser.
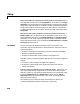
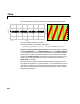
Run your model to see the time domain output, and then type the following
command to view the chirp output spectrogram.
specgram(dsp_examples_yout,[0:.01:40],400,hamming(128),110)
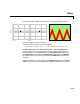
Example 4: Output Sweep with Negative Frequencies.
Modify the Example 1 model by
changing
Sweep time to 1.5, Initial frequency to 25, and Target frequency
to
0. The output chirp of this example may not behave as you expect because the
sweep contains negative frequencies between 1 and 1.5 seconds. The sweep
reaches the
Target frequency of 0 Hertz at one second, then continues on its
negative slope, taking on negative frequency values until it traverses one
Sweep time (1.5 seconds).
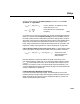
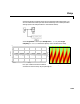
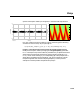
The spectrogram may reflect negative sweep frequencies along the x-axis so
they appear to be positive, as in the one below. If you unexpectedly get a chirp
output with a spectrogram resembling the one following, your chirp’s sweep
may contain negative frequencies. See the next example for another possible
unexpected chirp output.
Time (s)
FREQUENCY
0 1 2 3 4 5
0
5
10
15
20
25
30
35
40
0 1 2 3 4 5 6
−10
−5
0
5
10
Frame: 6
TIME (s)
AMPLITUDE