
User`s manual

Debugging Fortran Language MEX-Files
3-39
Note The name mexFunction may be slightly altered by the compiler (i.e., it
may have an underscore appended). To determine how this symbol appears in
a given MEX-file, use the UNIX command
nm <MEX-file> | grep -i mexfunction
To proceed from the breakpoint, issue a continue command to the debugger.
Once you hit one of your breakpoints, you can make full use of any facilities
your debugger provides to examine variables, display memory, or inspect
registers. Refer to the documentation provided with your debugger for
information on its use.
If you are at the MATLAB prompt and want to return control to the debugger,
you can issue the command
dbmex stop
which allows you to gain access to the debugger so you can set additional
breakpoints or examine source code. To resume execution, issue a
continue
command to the debugger.
Debugging on Windows
Compaq Visual Fortran
If you are using the Compaq (or DIGITAL) Visual Fortran compiler, you use
the Microsoft debugging environment to debug your program.
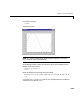
1 Start the Microsoft Visual Studio by typing at the DOS prompt
msdev filename.dll
2 In the Microsoft environment, from the Project menu, select Settings. In
the window that opens, select the
Debug tab. This options window contains
edit boxes. In the edit box labeled
Executable for debug session, enter the
full path where MATLAB resides. All other edit boxes should be empty.
3 Open the source files and set a break point on the desired line of code by
right-clicking with your mouse on the line of code.