
User`s guide

7 Models with Multiple Sample Rates
7-6
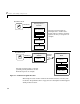
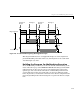
The following diagrams illustrate how mixed-rate systems are handled by the
Real-Time Workshop in these two environments.
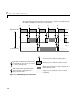
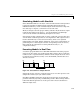
Figure 7-2: Multitasking System Execution
.
Hashed areas indicate task preemption by a
higher priority task
.
t0 t1 t2 t3 t4
Lowest Priority
Highest Priority
Vertical arrows indicate sample times.
Dark gray areas indicate task execution.
Dotted lines with downward pointing
to a lower priority task.
arrows indicate the release of control
Dotted lines with upward pointing
arrows indicate preemption by a
higher priority task.
rate 1
rate 2
rate 3
Light gray areas indicate task execution
is pending.