
User`s guide

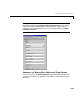
Table Of Contents
- Getting Started
- Using Instrumentation in a Model
- Categories of ActiveX Controls
- Placing ActiveX Controls in a Different Window
- Library Reference
- Index

Strip Chart
3-27
Strip Chart
The interface to the Strip Chart block is different from the interface to the
other preconfigured blocks in the Dials & Gauges Blockset. You can configure
the Strip Chart block using properties in its dialog box, just as you would for
other preconfigured blocks. However, to plot data on the chart, you must invoke
methods for the block. You can use the MATLAB command
invoke to call
methods of ActiveX control blocks and pass arguments to those methods.
An M-file S-function provided with the Dials & Gauges Blockset plots data on
the Strip Chart block by using the
invoke method. More generally, this
S-function illustrates how to communicate with any ActiveX control from the
MATLAB language through an S-function.
The file is called
ax_strip_sfun.m and is located in the main Dials & Gauges
Blockset directory. You can use the following MATLAB command to find the
location of this file on your computer.
which ax_strip_sfun
During initialization, the Simulink block attributes (sample time, input width,
etc.) are configured and the Strip Chart configuration is set. The infrastructure
of the Dials & Gauges Blockset provides the handle to the ActiveX control
(
hActX) and is available in this S-function.
You can use this handle to set the properties of the Strip Chart through the
standard “dot” notation. For example, the following line sets the
LastX
property of the Strip Chart to zero.
hActx.LastX = 0;
Any property of the Strip Chart can be set in this fashion.
In the outputs section of the S-function, each track of the Strip Chart is
initialized to zero on the time axes and the actual plotting of the data is
performed. A loop is included in this section to account for vector signals sent
to the Strip Chart from Simulink.
Note that S-functions offer more options than those shown in this example. See
Writing S-Functions for more details on writing your own S-functions.