
User`s guide

Table Of Contents
- Getting Started
- Using Instrumentation in a Model
- Categories of ActiveX Controls
- Placing ActiveX Controls in a Different Window
- Library Reference
- Index
Linear Gauges
5-9
5Linear Gauges
Purpose Display input value on a line
Description Blocks in the Linear Gauges library reflect their input value graphically on a
scale that lies along a line. If the input value is greater than the scale’s
maximum or less than the scale’s minimum, then the block displays the
maximum or mininum value, respectively. To learn how to use and customize
blocks in this library, see “Linear Gauges” on page 3-16.
Note Blocks in this library can display multiple linear scales. The Multiple
Scales block displays multiple linear scales by default. However, input signals
to the blocks must be scalar signals. If you want to display additional dynamic
values, then you can control the display via an M-file S-function that uses the
ActiveX support features in MATLAB. The M-file S-function
ax_strip_sfun.m
illustrates this approach; also, see the ActiveX documentation.
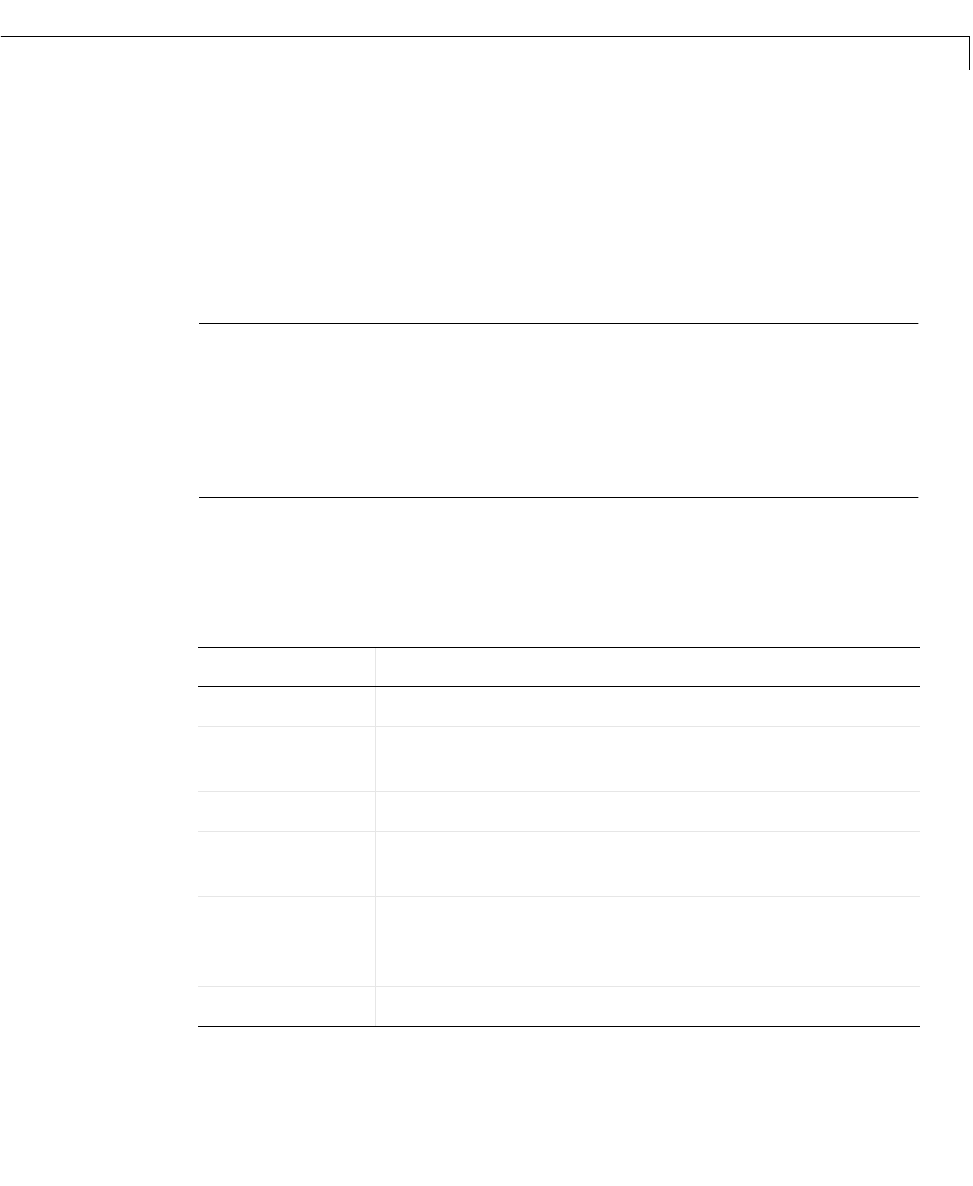
Dialog Box The ActiveX Control Properties dialog box governs the appearance and
functionality of the ActiveX control itself. The table below lists the panels of the
ActiveX Control Properties dialog box.
Panel Purpose
Background
Configure the background and outline of the block
Bands
Display linear or rectangular regions along the block’s
scale
Captions
Display annotations on the block
Digital
Display the numerical value corresponding to the
pointer
Fonts
Define text styles (The Captions, Digital, and Ticks
panels use the
FontID property to reference the styles
defined here.)
Library
Refer to property settings as a named collection