
Specifications

Viewing Explicit Instrumentation
5-18
5.8 Viewing Explicit Instrumentation
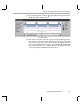
To view information provided by the explicit instrumentation calls you added,
you use the Statistics View and the RTA Control Panel.
1) Choose File
→
Load Program. Select the
program you just rebuilt, volume.out, and
click Open.
2) Choose Tools
→
DSP/BIOS
→
RTA Control
Panel.
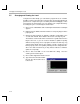
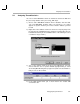
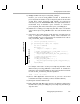
3) Right-click on the RTA Control Panel area
and deselect Allow Docking to display the
RTA Control Panel in a separate window.
Resize the window so that you can see all
of the check boxes shown here.
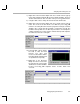
4) Put check marks in the boxes shown here
to enable SWI accumulators, USER0
trace, and to globally enable tracing on
the host. Enabling USER0 tracing causes
the calls to TRC_query(TRC_USER0) to
return 0.
5) Choose Tools
→
DSP/BIOS
→
Statistics View.
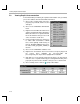
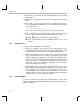
6) Right-click on the Statistics View area and choose Property Page from
the pop-up menu. Highlight the processing_SWI and
processingLoad_STS objects. Also, highlight all four statistics.
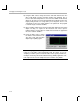
7) Click OK. You see the statistics fields for both objects. You may want to
make this area a separate window (by deselecting Allow Docking in the
pop-up menu) and resize the window so that you can see all the fields.
8) Choose Debug
→
Run or click the (Run) toolbar button.