
Specifications

Analyzing Thread Statistics
Debugging Program Behavior
5-15
5.6 Analyzing Thread Statistics
You can use other DSP/BIOS controls to examine the load on the DSP and
the processing statistics for the processing_SWI object.
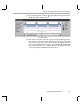
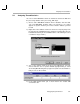
1) Choose Tools
→
DSP/BIOS
→
Statistics View. A Statistics View area that
says Load DSP/BIOS program and/or set property to use control
appears. It says this because you need to select the statistics you want
to view.
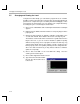
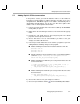
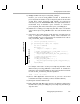
2) Right-click on the Statistics View area and choose Property Page from
the pop-up menu. Highlight the items shown here and click OK. (You can
hold down the Ctrl key to select individual items or the Shift key to select
a continuous range of items.)
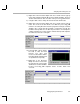
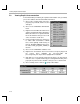
3) You see the statistics fields for the processing_SWI objects. You may
want to make this area a separate window (by right-clicking on it and
deselecting Allow Docking in the pop-up menu) and resize the window so
that you can see all four fields.
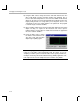
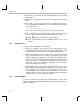
4) In the RTA Control Panel, put a check mark in the enable SWI
accumulators box.