
Specifications

Viewing Thread Execution with the Execution Graph
Debugging Program Behavior
5-11
9) Choose Debug
→
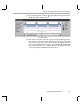
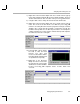
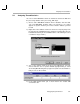
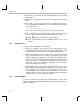
Run or click the (Run) toolbar button. The Execution
Graph should look similar to this:
10) The marks in the Time row show each time the Clock Manager ran the
CLK functions. Count the marks between times the processing_SWI
object was running. There should be 10 marks. This indicates that the
processing_SWI object ran its function every tenth time the dataIO_CLK
object ran its function. This is as expected because the mailbox value that
is decremented by the dataIO function starts at 10.