
Specifications

Viewing Thread Execution with the Execution Graph
5-10
5.4 Viewing Thread Execution with the Execution Graph
While you could test the program by putting a Probe Point within the
processing function and view graphs of input and output data (as you did in
the previous chapter), you have already tested the signal processing
algorithm. At this stage of development, your focus is on making sure the
threads can meet their real-time deadlines.
1) Choose File
→
Load Program. Select the program you just built,
volume.out in the volume2 folder, and click Open.
2) Choose Debug
→
Go Main. The program runs to the first statement in the
main function.
3) Choose Tools
→
DSP/BIOS
→
RTA Control
Panel. You see a list of instrumentation
types at the bottom of the Code
Composer Studio window.
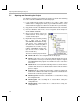
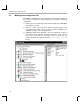
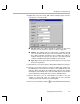
4) Right-click on the area that contains the
check boxes and deselect Allow
Docking, or select Float in Main Window,
to display the RTA Control Panel in a
separate window. Resize the window so
that you can see all of the check boxes
shown here.
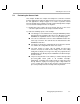
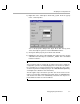
5) Put check marks in the boxes shown
here to enable SWI and CLK logging and
to globally enable tracing on the host.
6) Choose Tools
→
DSP/BIOS
→
Execution
Graph. The Execution Graph appears at
the bottom of the Code Composer Studio window. You may want to resize
this area or display it as a separate window.
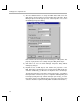
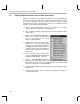
7) Right-click on the RTA Control Panel and choose Property Page from the
pop-up menu.
8) Verify that the Refresh Rate for Message Log/Execution Graph is 1
second and click OK.