
Specifications
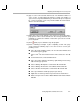

Adjusting and Profiling the Processing Load
Testing Algorithms and Data from a File
4-17
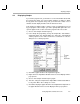
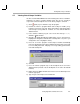
12) Type
2
as the new load and click Execute. The maximum number of
cycles for the second profile-point changes to 2018. The number of
cycles increases by about 1000 when you increment the processingLoad
by 1. These instruction cycles are performed within the load function,
which is stored in load.asm.
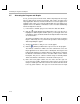
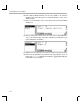
13) Right-click on the Profile Statistics area and choose Clear All from the
pop-up menu. This resets the statistics to 0. The average, maximum, and
minimum are equal to the number of instruction cycles for the current
processingLoad.
14) Click (Halt) or press Shift F5 to stop the program.
15) Before continuing to Chapter 5 (after completing section 4.10, page
4-18), perform the following steps to free the resources used in your
profiling session:
■
Close the Load and Gain controls, the sine.dat control window, and
the Time/Frequency graphs.
■
Choose File
→
File I/O and click Remove File to delete the sine.dat
file.
■
In the Profiler menu, uncheck Enable Clock.
■
Close the Profile Statistics window by right-clicking and choosing
Hide from the pop-up menu.
■
Choose Debug
→
Breakpoints. Select Delete All and click OK.
■
Choose Debug
→
Probe Points. Select Delete All and click OK.
■
Choose Profiler
→
Profile-points. Select Delete All and click OK.
■
Close open windows and the project (Project
→
Close).
■
Right-click on volume.gel in the Project View and select Remove.
■
Delete all expressions from the Watch Window and hide the Watch
Window.