
Specifications

Adjusting and Profiling the Processing Load
4-16
4.9 Adjusting and Profiling the Processing Load
In Chapter 2, you used profile-points to measure the number of cycles
required to call puts(). Now, you use profile-points to see the effect of
changing the processingLoad variable, which is passed to the assembly load
routine. The processingLoad is initially set to BASELOAD, which is defined as
1 in volume.h.
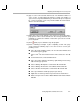
1) Choose Profiler
→
Enable Clock. Make sure you see a check mark next to
this item in the Profiler menu. (If you see a resource conflict message,
close any DSP/BIOS plug-in windows. Then choose Tools
→
RTDX and
select RTDX Disable from the pull-down list.)
2) Double-click on the volume.c file in the Project View.
3) Put your cursor in the line that says:
load(processingLoad);
4) Click the (Toggle Profile-point) toolbar button or right-click and select
Toggle Profile Pt.
5) Put your cursor in the line that says:
return(TRUE);
6) Click the (Toggle Profile-point) toolbar button.
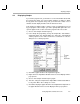
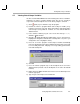
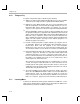
7) Choose Profiler
→
View Statistics. The locations shown identify the line
number where you added the profile-points. You may want to resize the
Statistics area so that you can see the Maximum column. Or, you can
right-click on the Statistics area and deselect Allow Docking to display the
statistics in a separate window.
8) If the locations are not listed in ascending order by line number, click the
Location column header.
9) Click the (Animate) toolbar button or press F12.
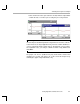
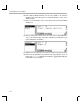
10) Notice the maximum number of cycles shown for the second profile-point.
It should be about 1018 cycles. (The actual numbers shown may vary,
especially if you are using a non-generic development board.) This is the
number of cycles required to execute the load routine when the
processingLoad is 1.
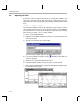
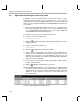
11) Choose GEL
→
Application Control
→
Load.