
Specifications

Displaying Graphs
Testing Algorithms and Data from a File
4-9
4.4 Displaying Graphs
If you ran the program now, you would not see much information about what
the program was doing. You could set watch variables on addresses within
the inp_buffer and out_buffer arrays, but you would need to watch a lot of
variables and the display would be numeric rather than visual.
Code Composer Studio provides a variety of ways to graph data processed
by your program. In this example, you view a signal plotted against time. You
open the graphs in this section and run the program in the next section.
1) Choose View
→
Graph
→
Time/Frequency.
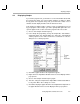
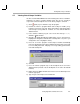
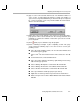
2) In the Graph Property Dialog, change the Graph Title, Start Address,
Acquisition Buffer Size, Display Data Size, Autoscale, and Maximum
Y-value properties to the values shown here. Scroll down or resize the
dialog box to see all the properties.
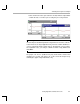
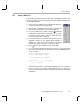
3) Click OK. A graph window for the Input Buffer appears.
4) Right-click on the Input Buffer window and choose Clear Display from the
pop-up menu.
5) Choose View
→
Graph
→
Time/Frequency again.
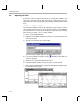
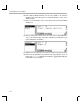
6) This time, change the Graph Title to Output Buffer and the Start Address
to out_buffer. All the other settings are correct.
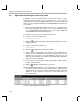
7) Click OK to display the graph window for the Output Buffer. Right-click on
the graph window and choose Clear Display from the pop-up menu.