
Specifications

Profiling DSP/BIOS Code Execution Time
3-8
3.4 Profiling DSP/BIOS Code Execution Time
Earlier, you used the profiling features of Code Composer Studio to find the
number of cycles required to call puts(). Now, you can do the same for the call
to LOG_printf.
1) Choose File
→
Reload Program.
2) Choose Profiler
→
Enable Clock. Make sure you see a check mark next to
this item in the Profiler menu.
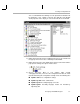
3) Double-click on the hello.c file in the Project View.
4) Choose View
→
Mixed Source/ASM. Assembly instructions are listed in
gray following each C source code line.
5) Put your cursor in the line that says:
LOG_printf(&trace, "hello world!");
6) Click the (Toggle Profile-point) toolbar button. This line and the
assembly language instruction that follows it are highlighted in green.
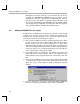
7) Scroll down and put your cursor in the line for the final curly brace of the
program, and click the (Toggle Profile-point) toolbar button.
You might think that you should set the second profile-point on the line
that says
return;
since that is the last statement in the program.
However, notice that there are no assembly language equivalents shown
until after the curly brace. If you set the profile-point at the line that says
return;
, Code Composer Studio automatically corrects the problem at
run time.
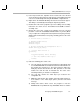
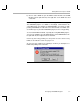
8) Choose Profiler
→
View Statistics.
9) Make sure the line numbers are in ascending order. If they are in the
reverse order, click the Location column heading once.
10) Click the (Run) toolbar button or press F5 to run the program.
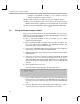
11) Notice the number of instruction cycles shown for the second
profile-point. It should be about 36. (The actual numbers shown may
vary.) This is the number of cycles required to execute the call to
LOG_printf.